ISCO Flowlink 5 description
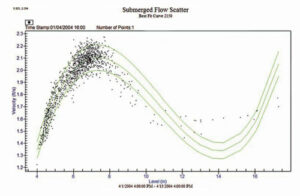
Flowlink generates a variety of informative graphs and tables. You can display simple graphs with a single mouse click, or conduct very sophisticated analyses of your data.
Standard Features
- Drag and drop data onto graphs and tables
- Generate graphs with up to 4 panes, with up to 4 types of data in each pane
- Zoom into graphs
- Click and display values on graphs
- Edit data and instantly view your changes in both a graph and a table.
- Calculate average, minimum, maximum and total values
- Compare data from multiple sites
- Compare flows based on the Continuity Equation and the Manning formula
- Add, subtract, multiply and divide data
- Object Linking and Embedding (OLE) lets you include Flowlink graphs and tables in Microsoft Word®, Excel® and PowerPoint®. Flowlink also exports data to spreadsheet files for analysis with programs such as Microsoft Excel.
- Schedules let you automatically retrieve data, print graphs and tables, import and export data, and run command-line drive programs such as macros from Excel.
- Archive data to a zipped file or a network drive, and back up your database to protect your data from computer glitches.


